Stop Trying to Make Google, Facebook and GA4 Agree
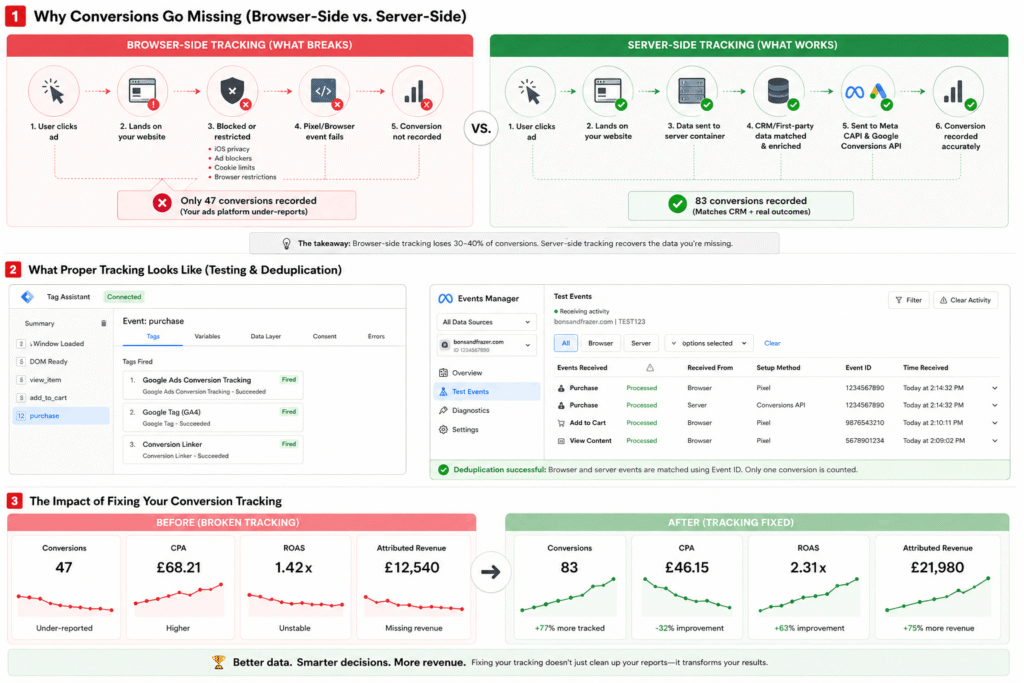
Open your ad dashboards on any given Monday morning and you will see something that makes no logical sense. Google Ads says you had 94 conversions last month. Meta Ads Manager claims 71. GA4 reports 52. Your CRM shows 63 actual customers.
Same business. Same month. Same campaigns. Four completely different answers.
If you have spent any time trying to figure out which number to believe, you have already done something counterproductive — because the question is wrong. None of these numbers is the correct one. Each is a different and valid answer to a slightly different question. The problem is that nobody tells you what question each platform is answering.
That gap — between what the platforms show and what you think they’re showing — is where budget decisions go wrong, campaigns get cut that should be scaled, and agencies spend client calls defending numbers that were never designed to match.
This guide explains every mechanism that creates the divergence: the attribution windows, the identity resolution differences, the view-through counting rules, and the two significant 2026 Facebook attribution changes that have moved numbers across every advertiser’s account. By the end, you will know exactly what each figure means, which one to use for each type of decision, and how to tell the difference between a structural reporting difference and a genuine tracking failure that is costing you campaign performance.
Why does conversion data never perfectly match across platforms?
A large portion of the gap you’re seeing is not a tracking failure. It is the expected, intended result of four systems measuring the same event from four different angles with four different rulebooks. Chasing a state where all four numbers match is the wrong goal. It is not achievable, and attempting it will lead you to make configuration changes that introduce real problems in exchange for illusory alignment.
Understanding the gap — knowing which parts are structural and which parts indicate a genuine problem — is what lets you make confident decisions even when the dashboards disagree.
The structural sources of divergence fall into four categories:
Attribution windows determine how long after an ad interaction a platform will claim credit for a conversion. Facebook defaults to 7-day click, 1-day view. Google Ads defaults to 30-day click for Search and Display campaigns, per Google’s official conversion window documentation. GA4 uses data-driven attribution that distributes credit across all touchpoints in a journey. The same conversion is therefore counted by multiple platforms simultaneously — each correctly applying its own rules.
Identity resolution is how each platform connects an ad click to a later conversion. Google uses GCLIDs and signed-in account identity. Facebook uses its own cookie and account identity. GA4 relies on a browser cookie that breaks across devices. When a customer moves across devices between clicking an ad and converting, each platform resolves their identity differently — meaning some see the conversion and some don’t.
View-through attribution is credit claimed for conversions from users who saw an ad but never clicked. Facebook and Google both do this for certain campaign types. GA4 does not — it can only track sessions initiated by an actual click. This is the primary reason Facebook typically reports more conversions than GA4 for the same period.
Privacy changes have removed data that used to make the numbers closer. Apple’s iOS 14.5 App Tracking Transparency removed the cross-app signal Facebook relied on to link impressions to conversions. Cookie consent requirements mean users who decline tracking are invisible to GA4 but may still be partially attributed in ad platforms through other signals.
What changed in 2026 — and why do your Facebook numbers look different?
If your Facebook numbers fell in early 2026 and you changed nothing, this is almost certainly why — not a collapse in performance. We break down both changes, and exactly how to read them, in our Meta Pixel & Event Match Quality guide.
How do you tell a real tracking problem from normal variance?
This distinction matters enormously in practice. The wrong diagnostic is comparing platforms against each other. Google Ads and Facebook are not measuring the same thing — they cannot be used to validate each other.
The correct diagnostic is comparing each platform against your backend.
Pull your actual sales or leads from your CRM or backend system for the last 30 days. That is your baseline. Now compare each platform:
Google Ads conversions ÷ actual sales — a healthy ratio sits between 0.7 and 1.1. Google over-attributes slightly due to its long click window, but should be broadly in line with reality. Below 0.6 indicates significant tracking loss.
Facebook conversions ÷ actual sales — Facebook legitimately over-reports due to view-through attribution. Post-2026, healthy ratios are lower than pre-2026 baselines due to the attribution changes. Establish your current baseline from post-March 2026 data. If Facebook is showing below 0.6× your CRM sales, investigate a Pixel or CAPI failure.
Patterns that indicate a genuine tracking problem:
- GA4 shows significantly more conversions than Google Ads — likely GCLID loss or conversion action misconfiguration
- Either platform’s conversions doubled suddenly with no traffic increase — duplicate conversion actions
- Conversions dropped to zero in one platform while the other is stable — Pixel or tag failure
- ROAS varies wildly week to week with no changes to budget, creative, or seasonality — tracking instability, not performance variation
→ For step-by-step Google Ads tracking diagnosis: Google Ads conversion tracking troubleshooting guide
→ For step-by-step Facebook tracking diagnosis: Facebook Ads conversion tracking problems guide
How does broken tracking harm campaign performance, not just your reports?
Google’s Smart Bidding and Facebook’s delivery system are machine learning systems. They observe which users, queries, times of day, and audiences produce conversions — and allocate budget accordingly. When a large portion of conversions are missing from the data they learn from, the algorithm builds its model on a fraction of reality.
The specific consequences:
Smart Bidding underfunds your best campaigns. If a campaign generates 100 actual bookings but tracking only sees 60, the algorithm calculates a ROAS that is 40% lower than reality. It treats a profitable campaign as borderline. Bids stay conservative. Budget stays low.
Facebook’s lookalike audiences are built from an incomplete customer profile. If iOS opt-outs and blocked Pixels mean Facebook has only seen 60% of your actual buyers, its model of who your customer is reflects that partial picture. The audiences it builds — and the users it serves your ads to — are less accurate as a result.
You make the wrong strategic decisions. A campaign that appears to be at 1.2× ROAS is cut. It was actually running at 2.1× ROAS. Three months of budget is redirected to a weaker channel.
We see this constantly: a campaign that looks like a loss-maker is actually profitable — the platform simply cannot see the conversions. The fix is the measurement, not the campaign. We walk through the full setup, with a real client example, in our server-side tracking guide — and it is built into every account at our tracking service.
What does a correct tracking setup look like?
But that’s a different question to this one. This page is about how to read numbers that will never perfectly agree; the fix for an actual fault lives elsewhere. For the full setup, costs and what it recovers, see our server-side tracking guide, or run the 15-minute self-check in the Google Ads diagnosis or Facebook Pixel guide.
How do you use the data correctly when the numbers never match?
Establish a consistent comparison ratio for each platform and track it over time. If Facebook consistently reports 1.2× your CRM sales, that 1.2 multiplier is your baseline. A drop below 0.8× signals a tracking problem. A spike to 2.5× signals attribution degradation or duplicate counting. The ratio matters more than the absolute number.
Never use ad platform conversion totals as your primary figure in stakeholder reporting. Report actual customers from your backend. Explain that platform figures reflect attribution claims, not unique customer counts. This is not a limitation — it is the correct way to present performance data.
Frequently asked questions
Why does Facebook always report more conversions than GA4?
Facebook uses view-through attribution and a 7-day click window, crediting conversions from users who saw your ad without clicking and from users who clicked up to seven days before converting. GA4 only attributes conversions to sessions it directly tracked via link clicks. Facebook will structurally report higher numbers than GA4 — this is expected. The gap has narrowed since March 2026 as Facebook’s click definition now aligns with GA4’s.
My Facebook numbers dropped in 2026 — what happened?
Two separate changes. January 12, 2026: Facebook removed 7-day and 28-day view attribution windows — advertisers running awareness or video campaigns saw 15–40% drops overnight. March 3, 2026: Facebook changed its click definition — non-link interactions moved to engage-through attribution with a 1-day window. In both cases, check your CRM. If actual customer acquisition held steady, these are reporting corrections, not performance problems.
Why does Google Ads show more conversions than GA4?
Google Ads uses a 30-day click window and can model conversions from Consent Mode v2 estimates. GA4 uses data-driven attribution distributing credit across multiple channels — GA4 partially credits organic, email, and direct for conversions where they were also involved, whereas Google Ads claims full credit for any conversion following a Google click. Both are correct by their own rules.
What is the right conversion number to use for budget decisions?
Your CRM or backend sales data. It is the only figure that confirms actual customers rather than attribution claims. Use ad platform conversions as directional signals for in-platform optimisation — they matter for Smart Bidding quality — but not as the primary business metric.
How do I know if my tracking is broken or the numbers are just structurally different?
Compare each platform against your CRM, not against each other. Google Ads below 70% of CRM sales indicates tracking loss. Facebook below 60% of CRM sales indicates a Pixel or CAPI failure. A sudden drop in your established platform-to-CRM ratio is the primary signal — if Facebook was consistently running at 1.3× CRM and has dropped to 0.7× with no corresponding CRM decline, investigate immediately.
If your GA4, Google Ads, and Facebook numbers are telling different stories — and you’re not sure which one to trust — we’ll audit your tracking setup and show you what you’re actually missing.
Get a free tracking audit →Bons & Frazer resolves attribution discrepancies by fixing tracking at the source. See Google Ads management for Norfolk and Facebook Ads management for Norfolk.
Jamie Frazer is co-founder of Bons & Frazer, a performance marketing agency based in Norwich specialising in Google Ads, Facebook Ads, and tracking infrastructure for service businesses, clinics and e-commerce brands across the UK and internationally.